
Was there an 8X increase in Guillain-Barré syndrome incidence in the v-safe Pfizer cohort?
Was there an 8X increase in Guillain-Barré syndrome incidence in the v-safe Pfizer cohort?
Why the v-safe free text data matters

Summary:
Since v-safe is an active monitoring tool (unlike VAERS, which is passive), it is very well suited to Observed-vs-Expected (O/E) analysis for Adverse Events of Special Interest
And the AstraZeneca PSUR report has already provided us an excellent reference for “official” background incidence rates
But “coding” all free text entries into one of only two possible fields - PT_NAME (Preferred Term) and LLT_NAME (Lower Level Term) - can be quite misleading
for example, if a pre-existing condition is coded as a Preferred Term, it
a) overcounts the incidence of post-vaccine adverse reactions and
b) also does not surface pre-existing conditions1 (what is usually called HISTORY in VAERS)
Mapping v-safe free text entries to VAERS fields will be a good way to not only resolve these kinds of problems, it will also make the overall v-safe analysis much more insightful
Using NLP (Natural Language Processing) will allow us to do this at scale
After I published an article recently, Twitter friend a_nineties posted this:

I appreciate the feedback, but a_nineties is not completely correct about that statement. The actual factor is not 8X, and in fact it cannot even be resolved for now.
It can only be resolved using the v-safe free text information, which is why I wrote this reply:

I have built a small internal tool for myself for visualizing the v-safe checkin data, and I will use that to explain this and also point out why v-safe free text analysis is so important.
For example, let us first run a query to identify registrants who
a) took only the Pfizer vaccine2
b) had an PT_NAME of ‘Guillain-Barre syndrome‘
c) had one or more “SYSTEMIC_REACTION_OTHER” free text entries
There are four such registrants:

Let us look at the free text entries by registrant ‘3DW-14375-42224‘. There are two such entries.

In my v-safe checkin visualization tool, I display the PT_NAME for each checkin and below that I also display all the free text entries.
There are two such checkins.
This is the first checkin, on same day as Dose 1:

Notice that I have two tables. The one on the top is the Preferred Terms which were coded for that particular ResponseID: s243252934355179806338519020646861303665
The second table is just a list of all the free text SRO responses for that registrant.
I sorted them based on a very basic string similarity algorithm (Fuzz Ratio), so the free text entry on the top is the “best guess” that matched the PT_NAMEs which were coded.
Here is the checkin for same day for Dose 2:
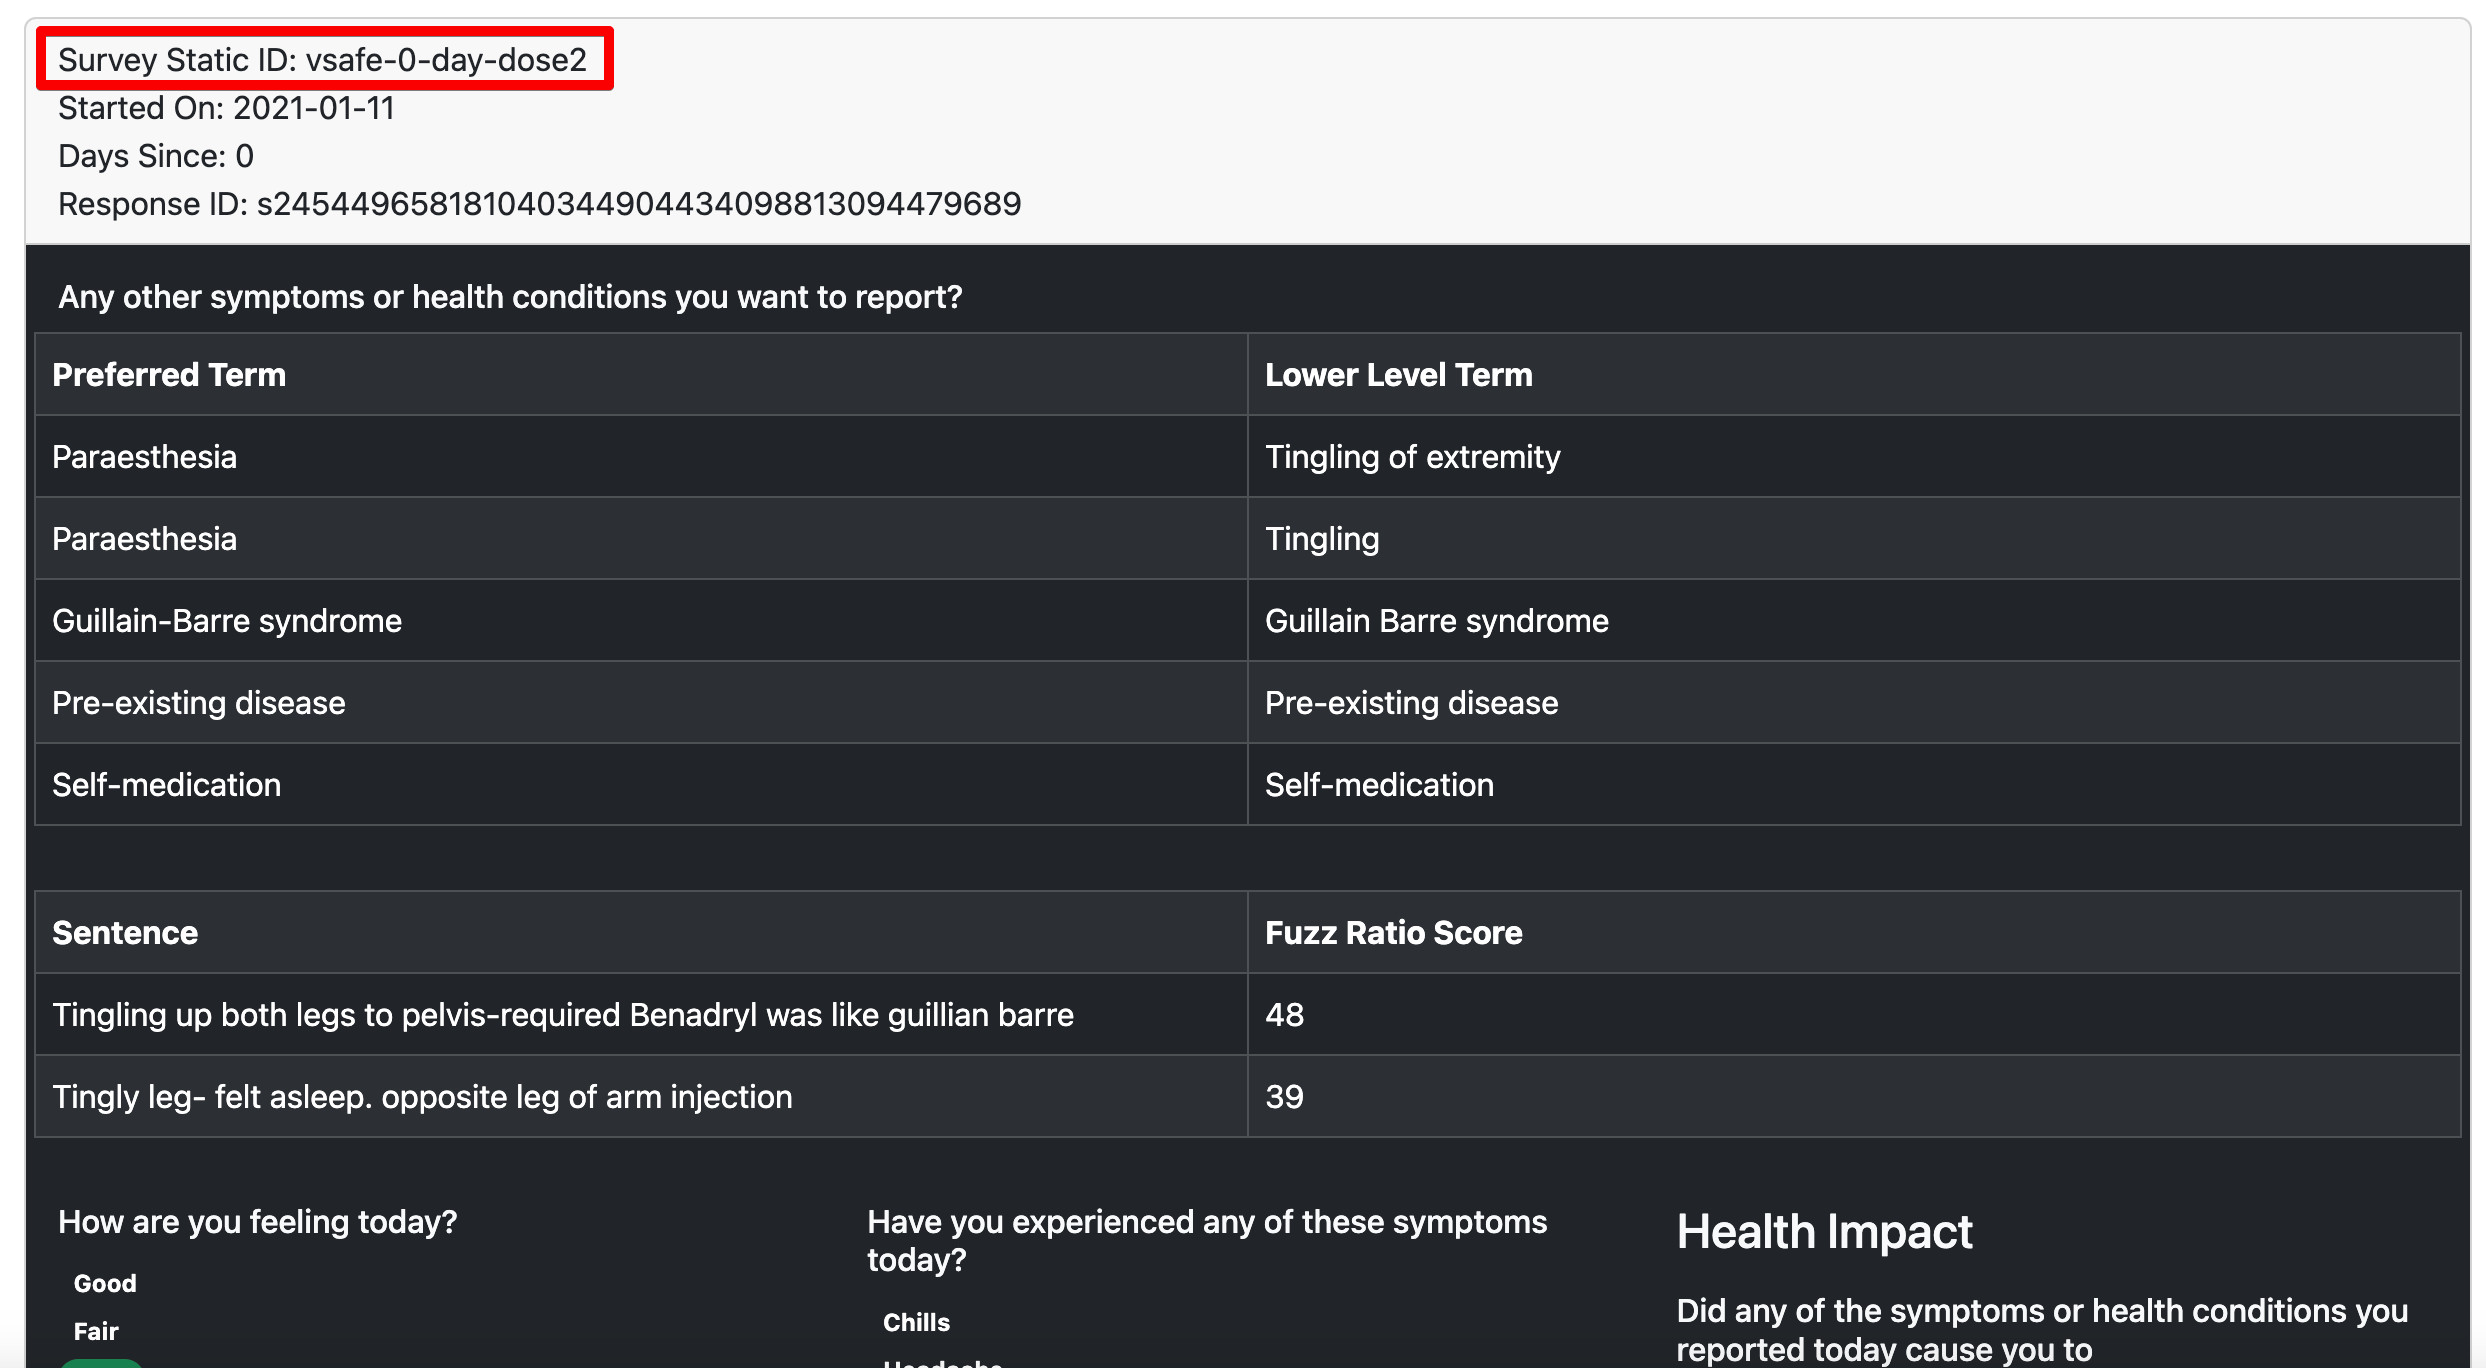
This is the responseID:
s245449658181040344904434098813094479689
In this particular example, there were two daily checkins, and exactly two free text entries. So the string similarity had to decide which checkin matched which free text entry.
Unfortunately, sometimes the data will have more SRO checkins than there are free text entries.
For example consider registrant code 3M8-15179-01041
They have four daily checkins:

But only one free text entry:

This makes the mapping even harder for the v-safe visualization tool.
For example, this mapping is quite obviously wrong. There are multiple severe symptoms in the top table, and the only free text entry is “Sniffles”

While my viz tool does not try and do any intelligent mapping as of now, you can still casually glance at it and see that the mapping failed in the case.
Since the CDC did not provide the ResponseID as one of the columns in the Free Text CSV file (as I discussed in my previous article), we need to resort to all this unnecessary effort of trying to map the PT_NAMEs to the free text entry.
The next release of the v-safe free text entries in mid-March will probably tell us whether this is intentional or just an unfortunate mistake on the part of the CDCLimitations of v-safe “Preferred terms” coding
In all the three CSV files3 - covid_meddra_sd, covid_meddra_sro and covid_meddra_hcvo, you see two columns - PT_NAME (Preferred Term) and LLT_NAME (Lower Level Term)
So we need to ask - why is everything in the free text converted into these low information fields?
For example, consider the free text entry I showed before - “Tingling up both legs to pelvis-required Benadryl was like guillian barre”
These are the PT_NAMES

But the actual field should be HISTORY, like what we have in VAERS.
This would simultaneously help us avoid two different mistakes - people doing Observed-vs-Expected analysis would not include these in their counts4, and people looking for whether the vaccine worsened pre-existing conditions would not exclude these in their counts.
In fact, mapping all the free text information into the VAERS CSV format5 will be much more useful while doing the overall analysis too.
Example: In their first weekly checkin on Day 14, let us say someone writes “On the 8th day after vaccination, I developed so-and-so adverse reaction”. Mapping this to VAERS means the NUMDAYS field will be 8.
Not only is this more accurate than directly using the v-safe checkin “Days_Since” field (which will be 14 or more), it also means the O/E analysis6 will surface the true danger of the vaccine.
For my future v-safe analysis, I will mostly be focusing my efforts on using Natural Language Processing to extract as much of the VAERS-like fields from the existing free text information.
Interestingly, “Pre-existing condition” itself is a Preferred Term in v-safe! But it is not very useful because of the way the data is normalized. If there are multiple adverse reactions listed for a specific checkin, which of the multiple conditions is pre-existing? We cannot tell without reading the free text entry!
I explain this pfizer-only dataset in my previous article
Read my previous article to learn more about the v-safe data format
O/E analysis is usually based on new adverse reactions and not pre-existing conditions
This is another example of why I think the VAERS CSV format was actually very thoughtfully designed. Many people complain about VAERS limitations, and in fact sometimes they wish VAERS would be more like v-safe (in terms of active monitoring), but you can see that we end up trying to reverse engineer everything back into the VAERS format!
Since a lower NUMDAYS value will reduce the “expected” denominator and increase the OE ratio