v-safe visualization tool with dynamic URLs
Due to server resource constraints I only display v-safe registrants who reported some health impact

Since VAERS has been around for a while, people have already built tools to see all information about an individual VAERS report based on a custom URL which contains the VAERS_ID.
I know of at least two - OpenVAERS and MedAlerts. There are other tools for seeing individual VAERS reports, but being able to see the information based on a dynamic URL is sort of the main point of this discussion.
There isn’t even any such tool for v-safe that I know of.
Unfortunately v-safe is a pretty large dataset, so it is not cheap to build tools for it. And I do think maintaining it can be quite expensive for independent researchers.
In fact ICAN has a dashboard which uses Microsoft BI, but it doesn’t provide a way to see all the data specific to a single registrant inside a timeline view.
So I built a simple tool which uses client side JavaScript (less load on my server) and uploaded it to my own website.
There are about 780K v-safe registrants who reported some health impact, such as needing to see the Doctor 
This is the subset I am using for this tool.
There are three reasons I am restricting the tool to this subset:
I plan to build a faceted search for this subset using Algolia which has a free plan which allows maximum of 1 million rows per index
I am uploading the data itself to my own website which has its own set of server resource limitations
I also want to focus on this subset because it is usually sufficient to show how badly the CDC has neglected free text information without making it too cumbersome to operate
The tool is here:
https://learnspacy.com/vsafe_timeline/index.html?id=9DZ-19514-38300
While the tool is really basic at the moment, I managed to create it in a way that actually makes it easy to read the information.
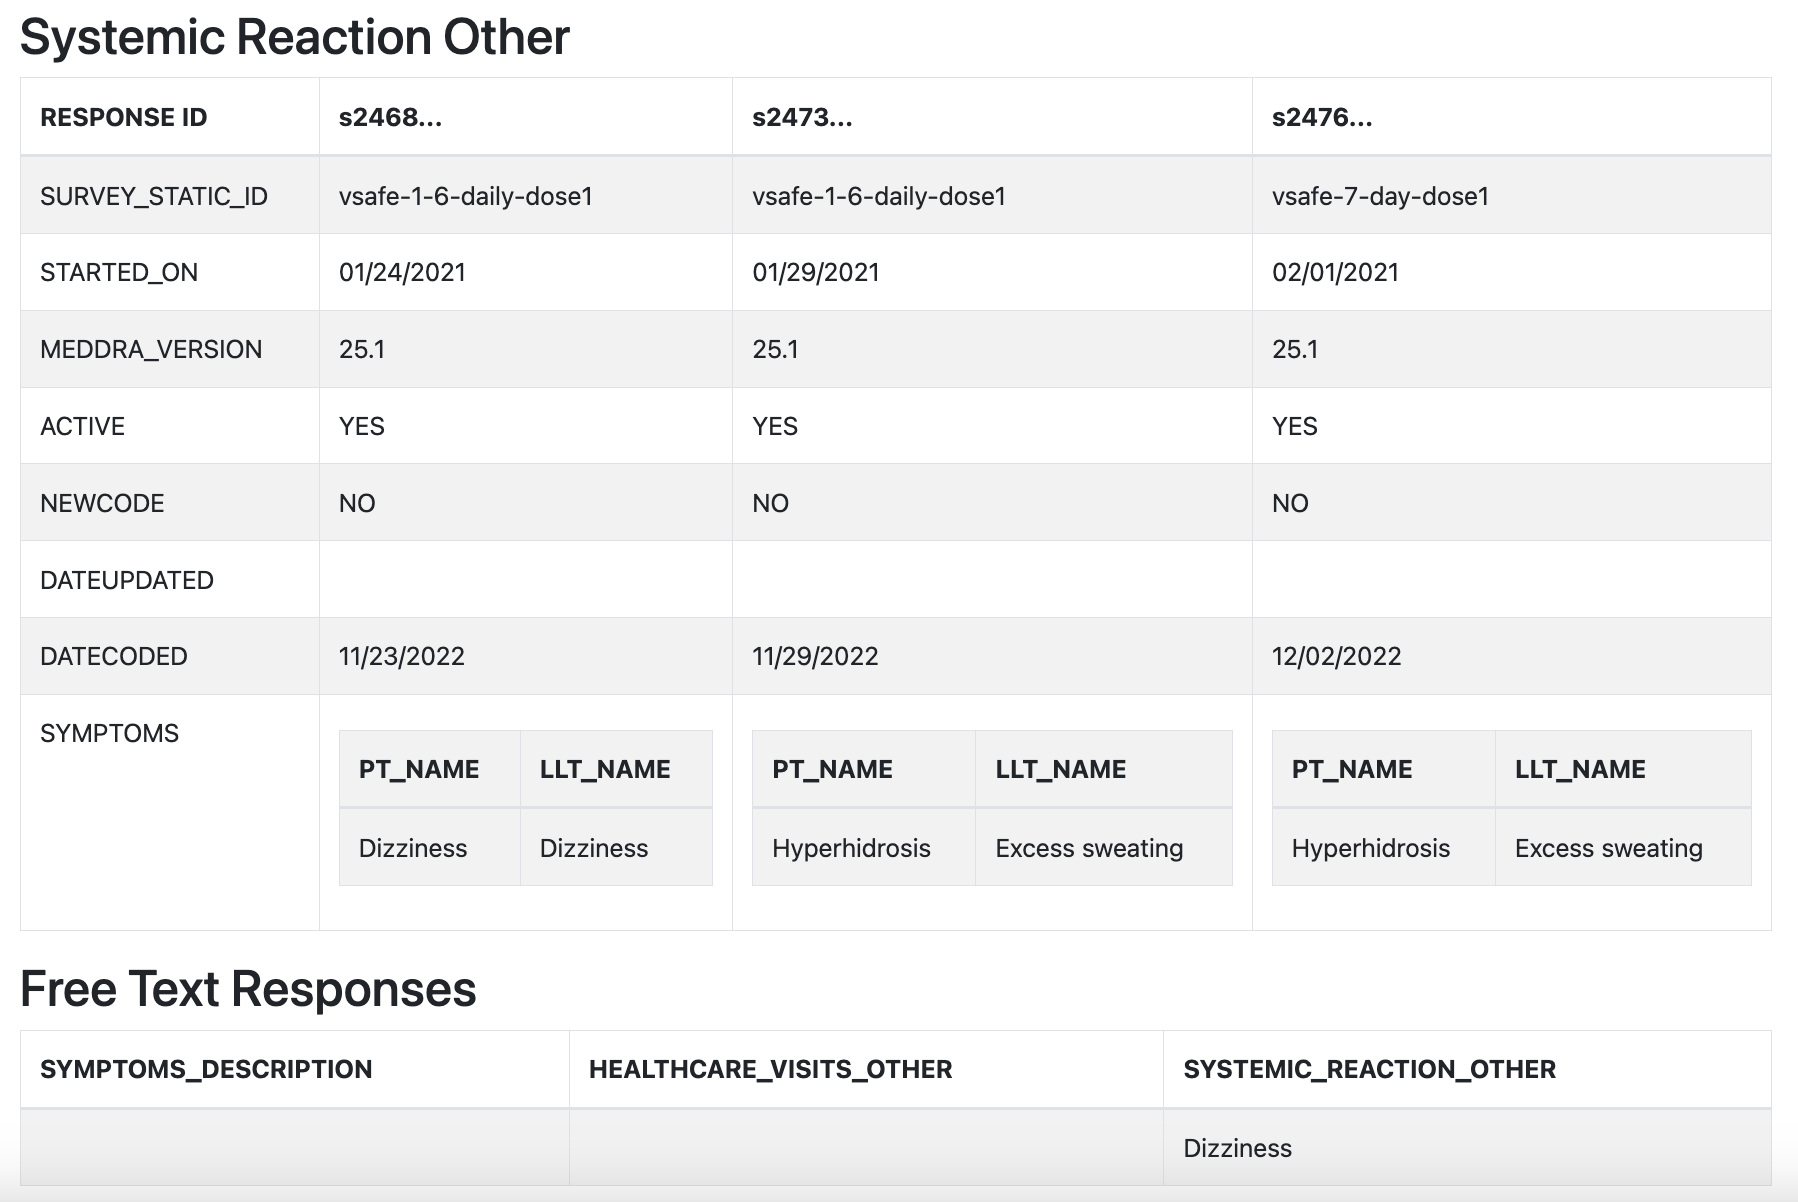
For example, the Systemic Reaction Other table is probably best rendered in the following way (transposed, and with a SYMPTOM row which lists all the symptoms as PT_NAME, LLT_NAME pairs within a nested table)
Just replace with any other id from the list below, and you will see all the information presented in a reasonably easy to browse format for that specific v-safe registrant.
I will be using this in my future v-safe articles.
This is really good. I'm getting 798K health impacts = required medical care. I guess you are just pulling a arbitrary number of 780K.
https://postimg.cc/0K7wwXyj
There are at least ~1122 DEAD of the 798K that required medical care, which is about half the total dead people so far identified.
https://postimg.cc/mPpS3DsH
If I went through and plucked out all the ~2300 dead people and the 172K "adolescents" and gave you a complete data set could you create this group of "reports" in your environment? My idea would be to then create a mini custom dashboard with hyperlinks to your reports...
I too run into limitations within Tableau using the free Tableau public environment
These reports are great! Very comprehensive and I'm already zeroing in the the death reports by matching the Reg ID# to mine like this guy (Arthur Roy Janes) 2CM-54569-13355
2CY-14857-72088, 2CD-22973-17145, 2PF-12687-39670, 2RX-31299-77991, 2SB-27500-55611
I use these examples of deaths above because they also have a MedDRA = Death
There will be many as of now that say "death" in the narrative but do not have a MedDRA. I don't think ICAN has supplied the full set of MedDRA for all 10M registrants? Substack article coming highlighting your excellent work.
If I could make one suggestion, it would be to put the Registrant ID# somewhere on the report.
See Here: https://postimg.cc/Wt0KS7mr