Some thoughts on the GoodSciencing list
Some thoughts on the GoodSciencing list
It needs vetting, but you can speed up the vetting process by writing some code

You might have heard about this recent analysis by Dr Peter McCullough (PM) comparing on-field athlete deaths since mRNA vaccine rollout to prior years.
From my quick searches it looks like Dr Peter McCullough’s article is paywalled, but the article cited by him (which is more relevant for my article) is not.
It is this article also called Lausanne Recommendations (LR) which when calculated on a per-year basis rounds up to about 30 on field athlete deaths per year between 1966 to 2004.
Dr PM compared it the GoodSciencing (GS) list found here.
Criticism of the comparison
As expected, there was some criticism of the GS list. And in my opinion, the criticism is fair.


As it stands, the GS list is a mixture of everything - people who died and did not, athletes versus non-athletes, people of all age groups and also some stories which later turned out to be either ambiguous or false.
By citing this list, Dr PM probably made it a very problematic comparison with the LS paper which has a more rigorous inclusion/exclusionary criteria, and obviously also passed peer review (plus this paper was published in 2006 and not after the COVID19 vaccine rollout, so I am inclined to take the whole peer review process a lot more seriously).
Which leads to another question - can we do a fairer comparison with prior years based on the existing GS list?
Preliminary Analysis
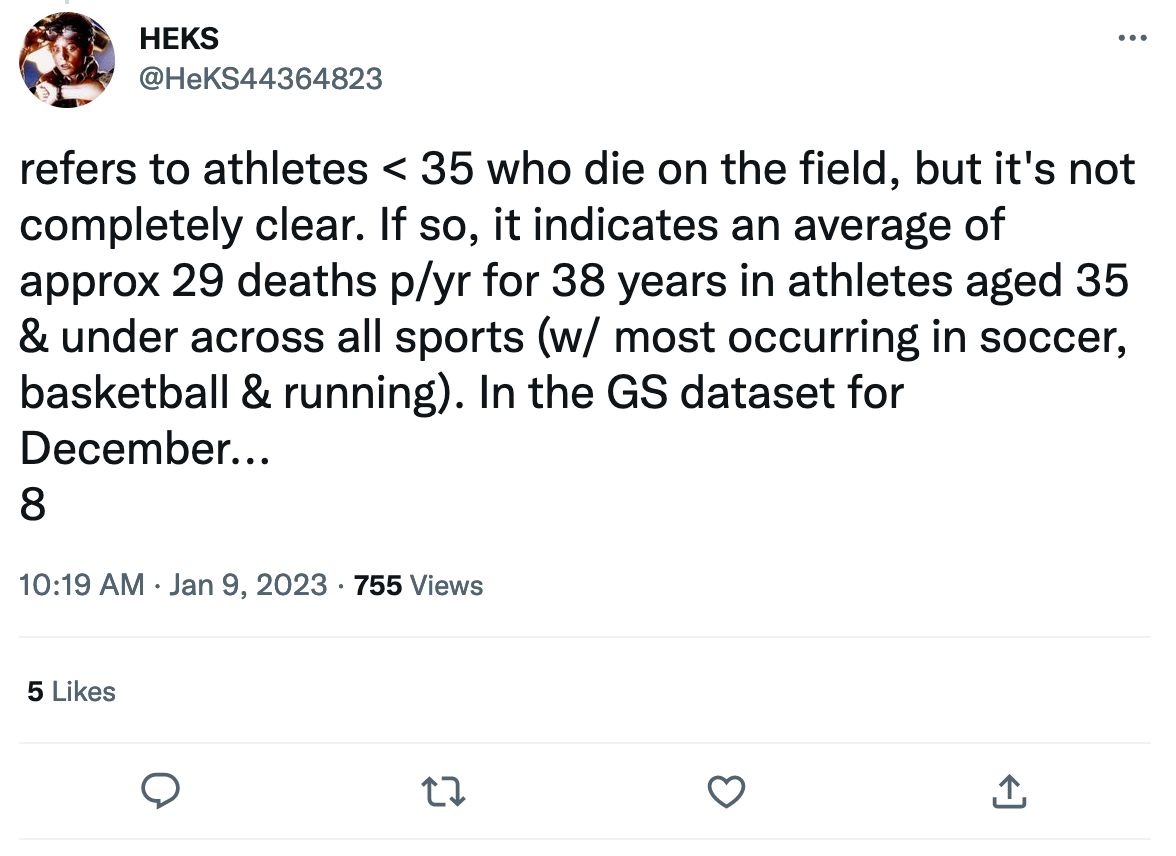
User HeKS44364823 on Twitter did some preliminary analysis for a single month (Dec 2022) and talked about their approach to separating out on-field and off-field deaths which sort of inspired this article.

Creating an “auto-vetted” dataset
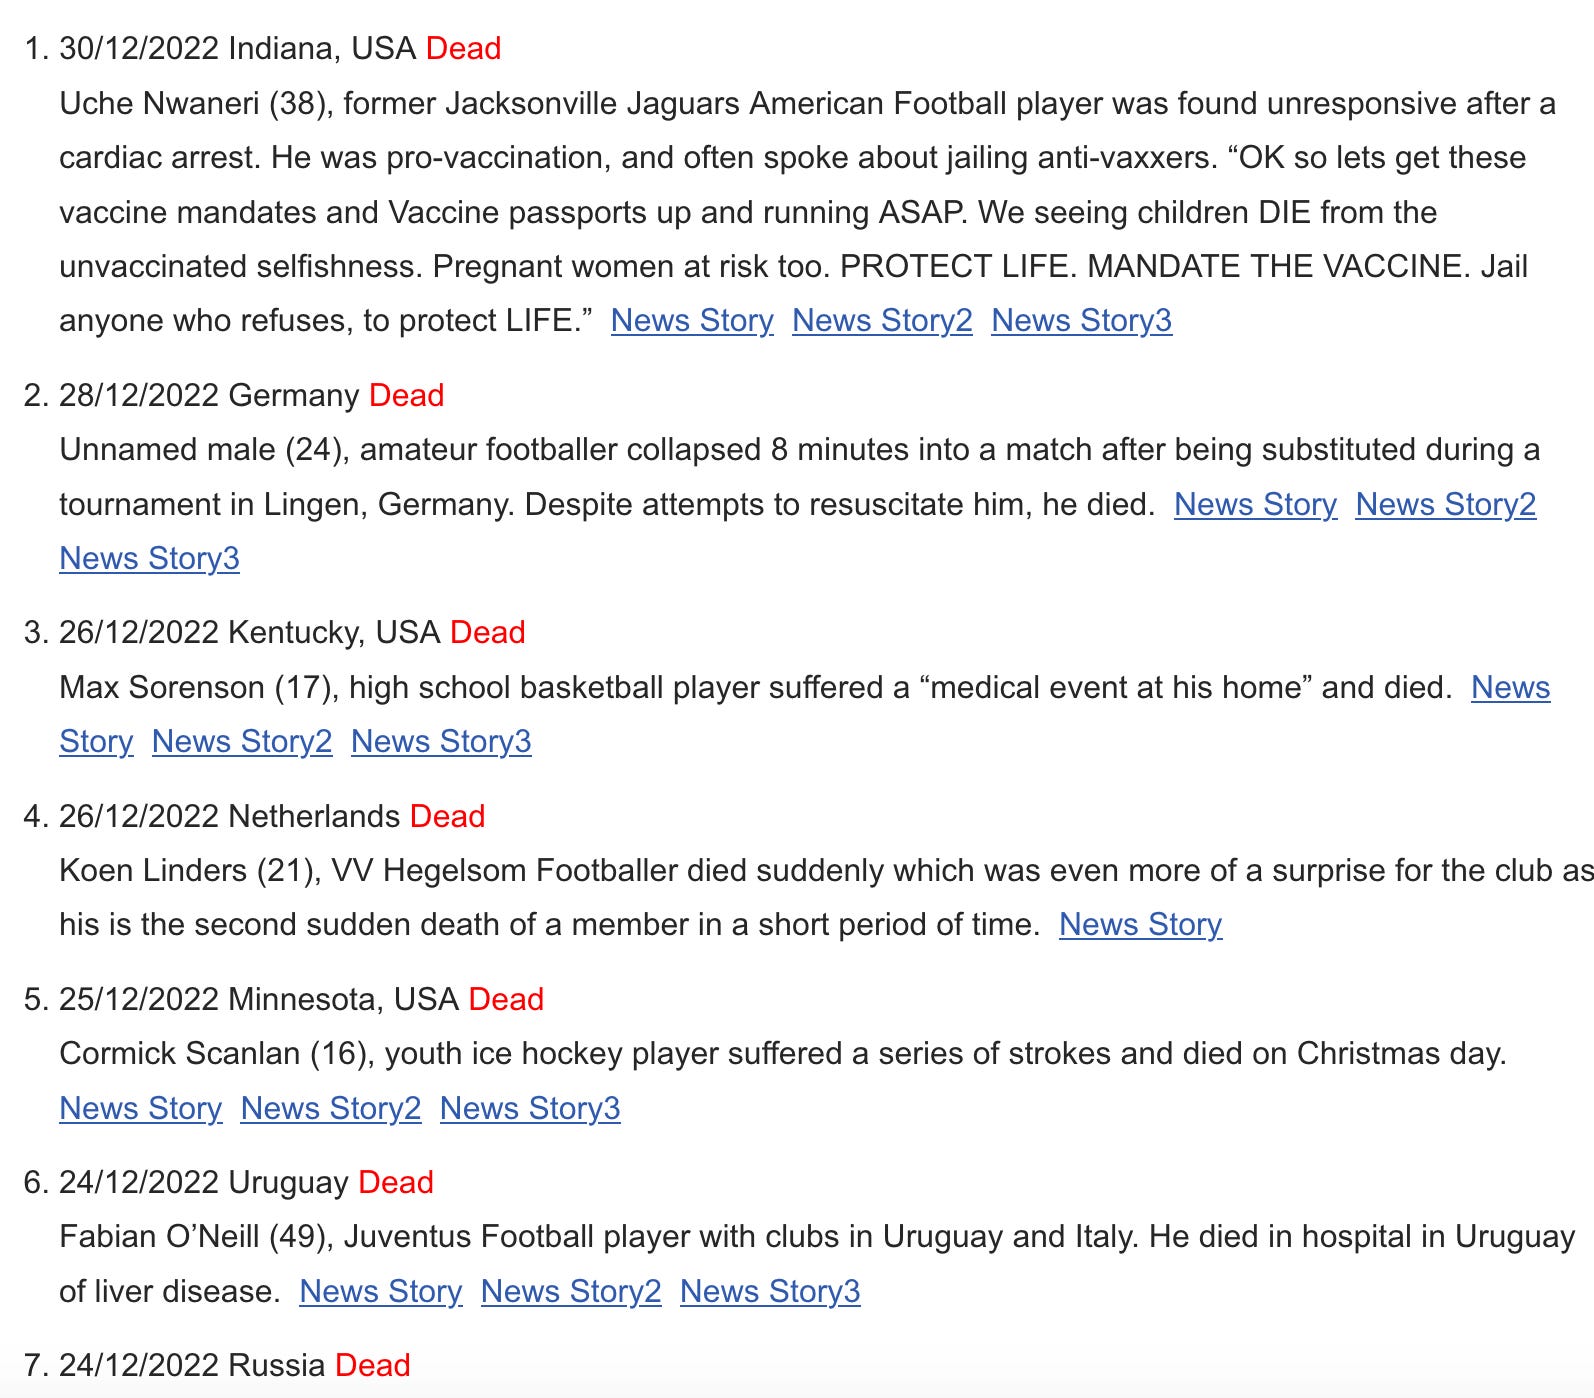
The HTML on the GS page is highly structured.
So I parsed the HTML on the GS page and turned it into a CSV file. This part is straight forward.
Then I added some code to automate the vetting.
To get the sport, I just manually created my own list of keywords after starting from this list and then adding in more after reading the descriptions of each entry in the GS list. I will then run the code, see which rows had SPORT = ‘UNK’, and iteratively keep updating the list.
To check for on-field vs off-field, I checked to see if the description contained one of the following phrases: “on field”, “on the field”, “game”, “match”, “during”. If I see one of these phrases, I will just add the sentence which contains the phrase into the ONFIELD cell.
I noticed that the word “during” is actually surprisingly effective at helping us discover on-field events.
I refer to this as an auto-vetted dataset since I did not do it manually, but instead used some algorithmic heuristics to guess the values for the SPORTS and ONFIELD columns. This means there will definitely be both false positives and false negatives. For example, there will be some events marked as on-field even if they are not (false positives) and some others marked as UNK even if you can see that they did happen on-field (false negatives).
The goal of creating this is not to create perfectly vetted data, but to help people analyze the original GS list more quickly.
Some basic analysis on the auto-vetted dataset
So what happens if we do an apples-to-apples comparison?
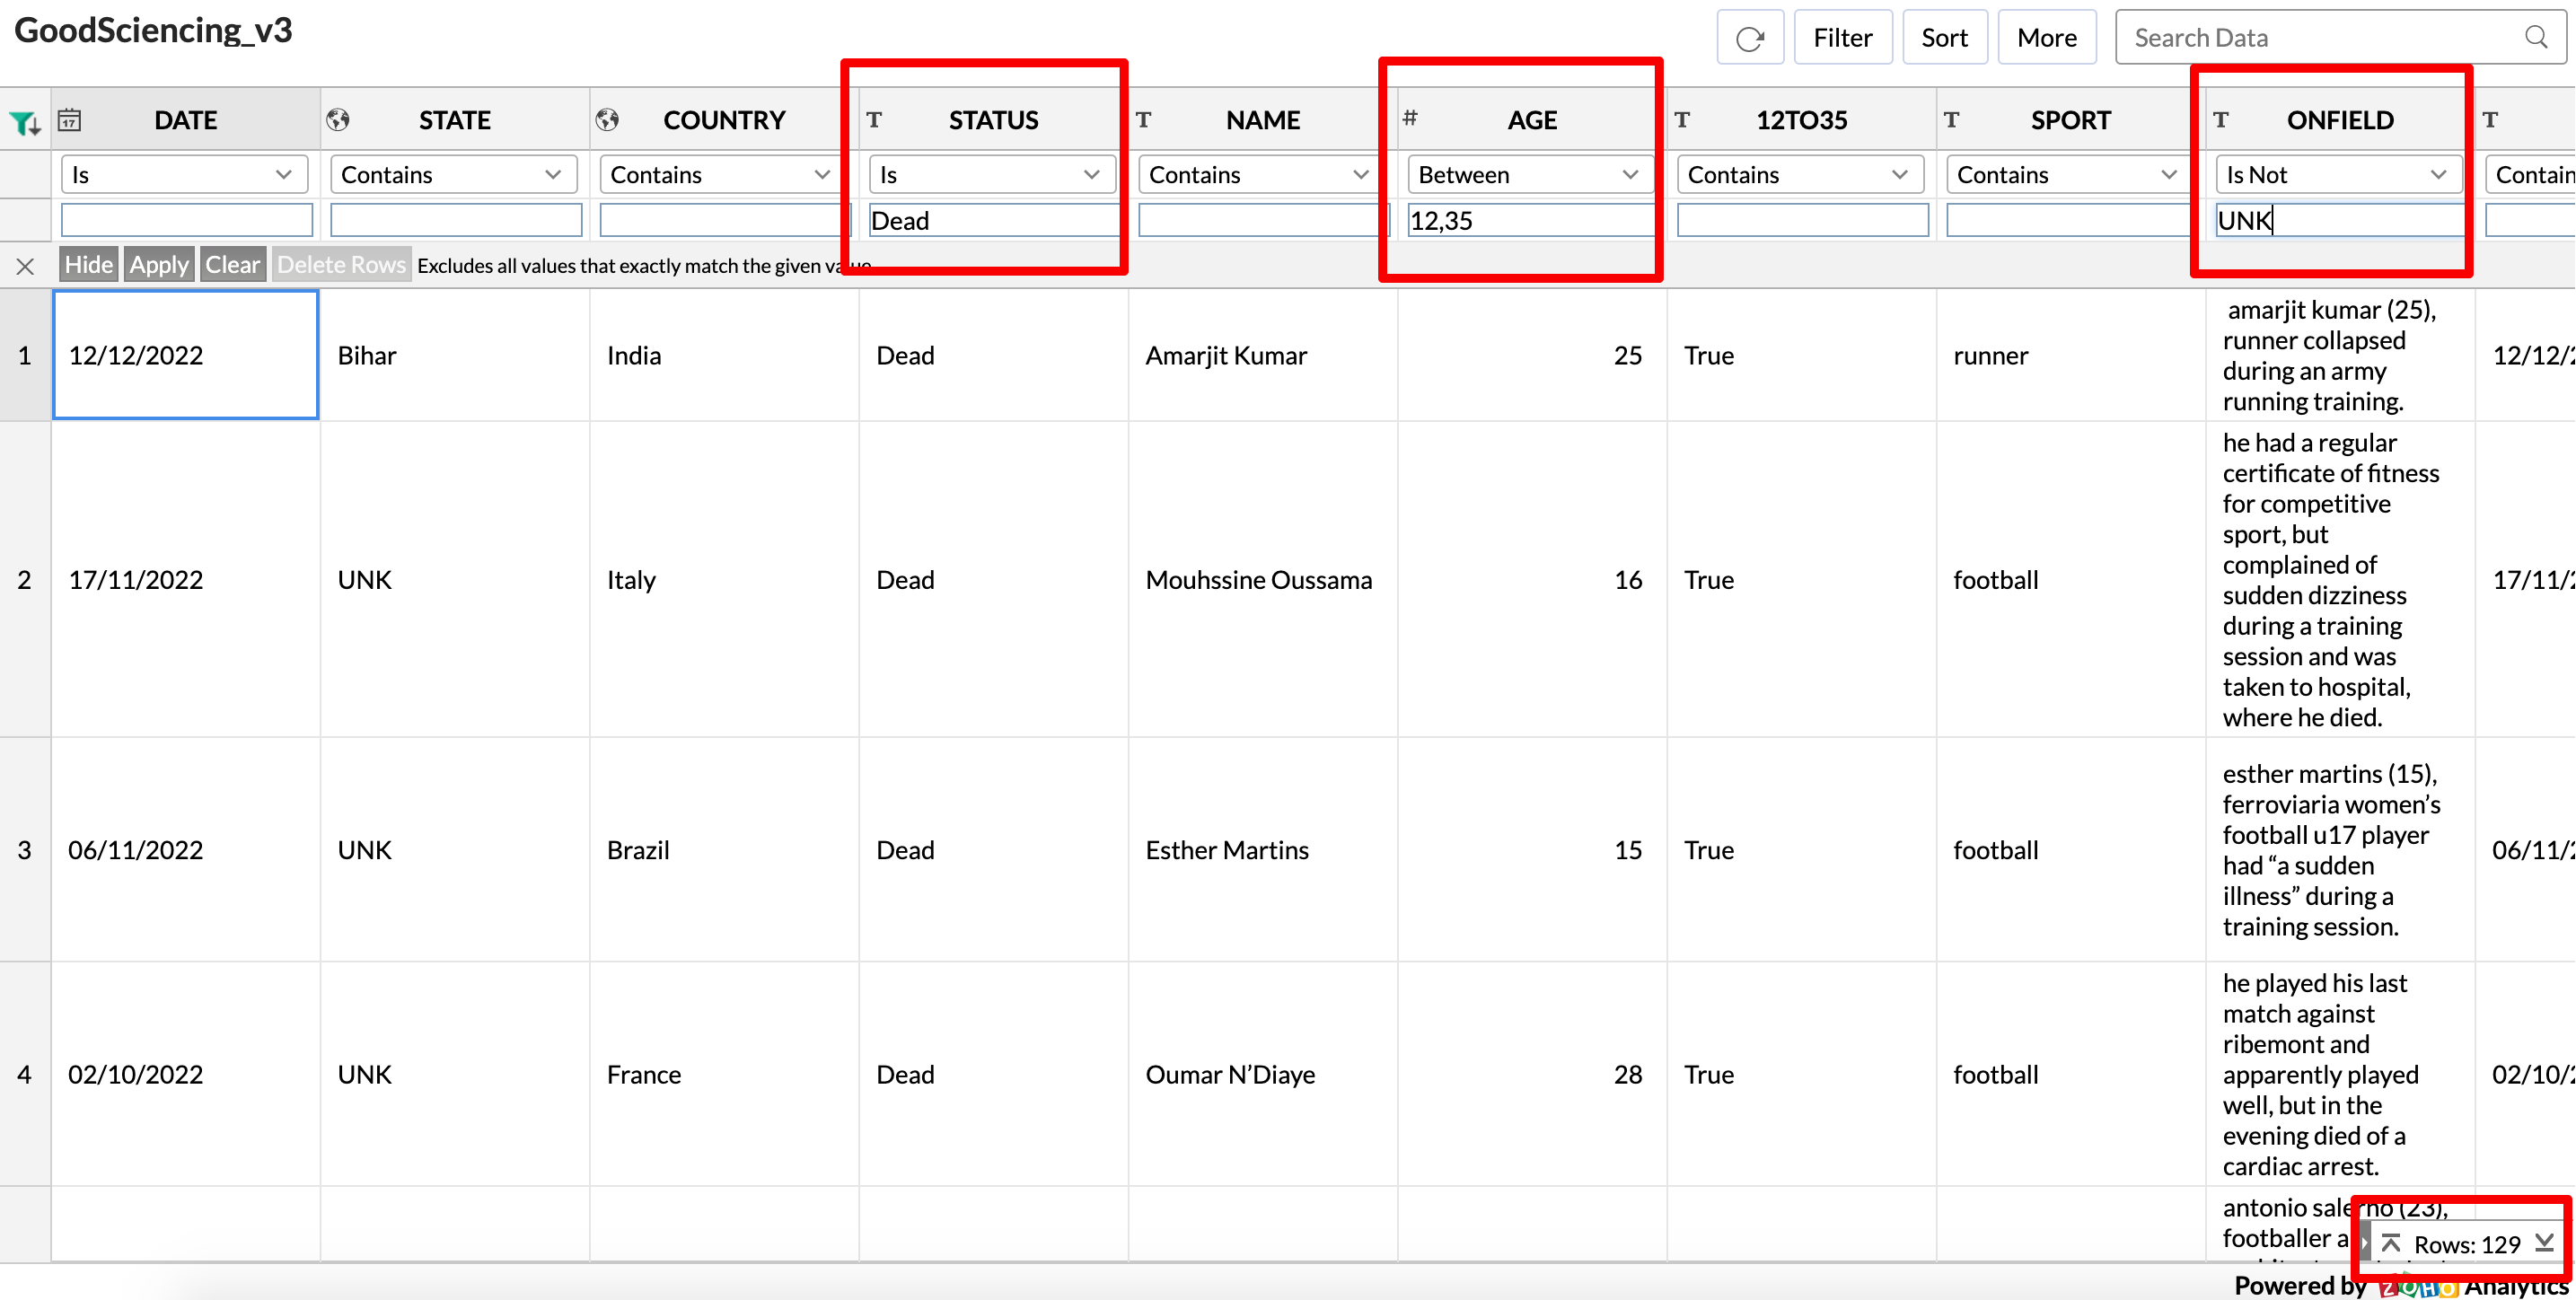
So I will filter for athlete deaths for ages between 12 to 35 and which happened on-field. Note that this is how the LS paper also does it, so it makes this a much more accurate comparison.
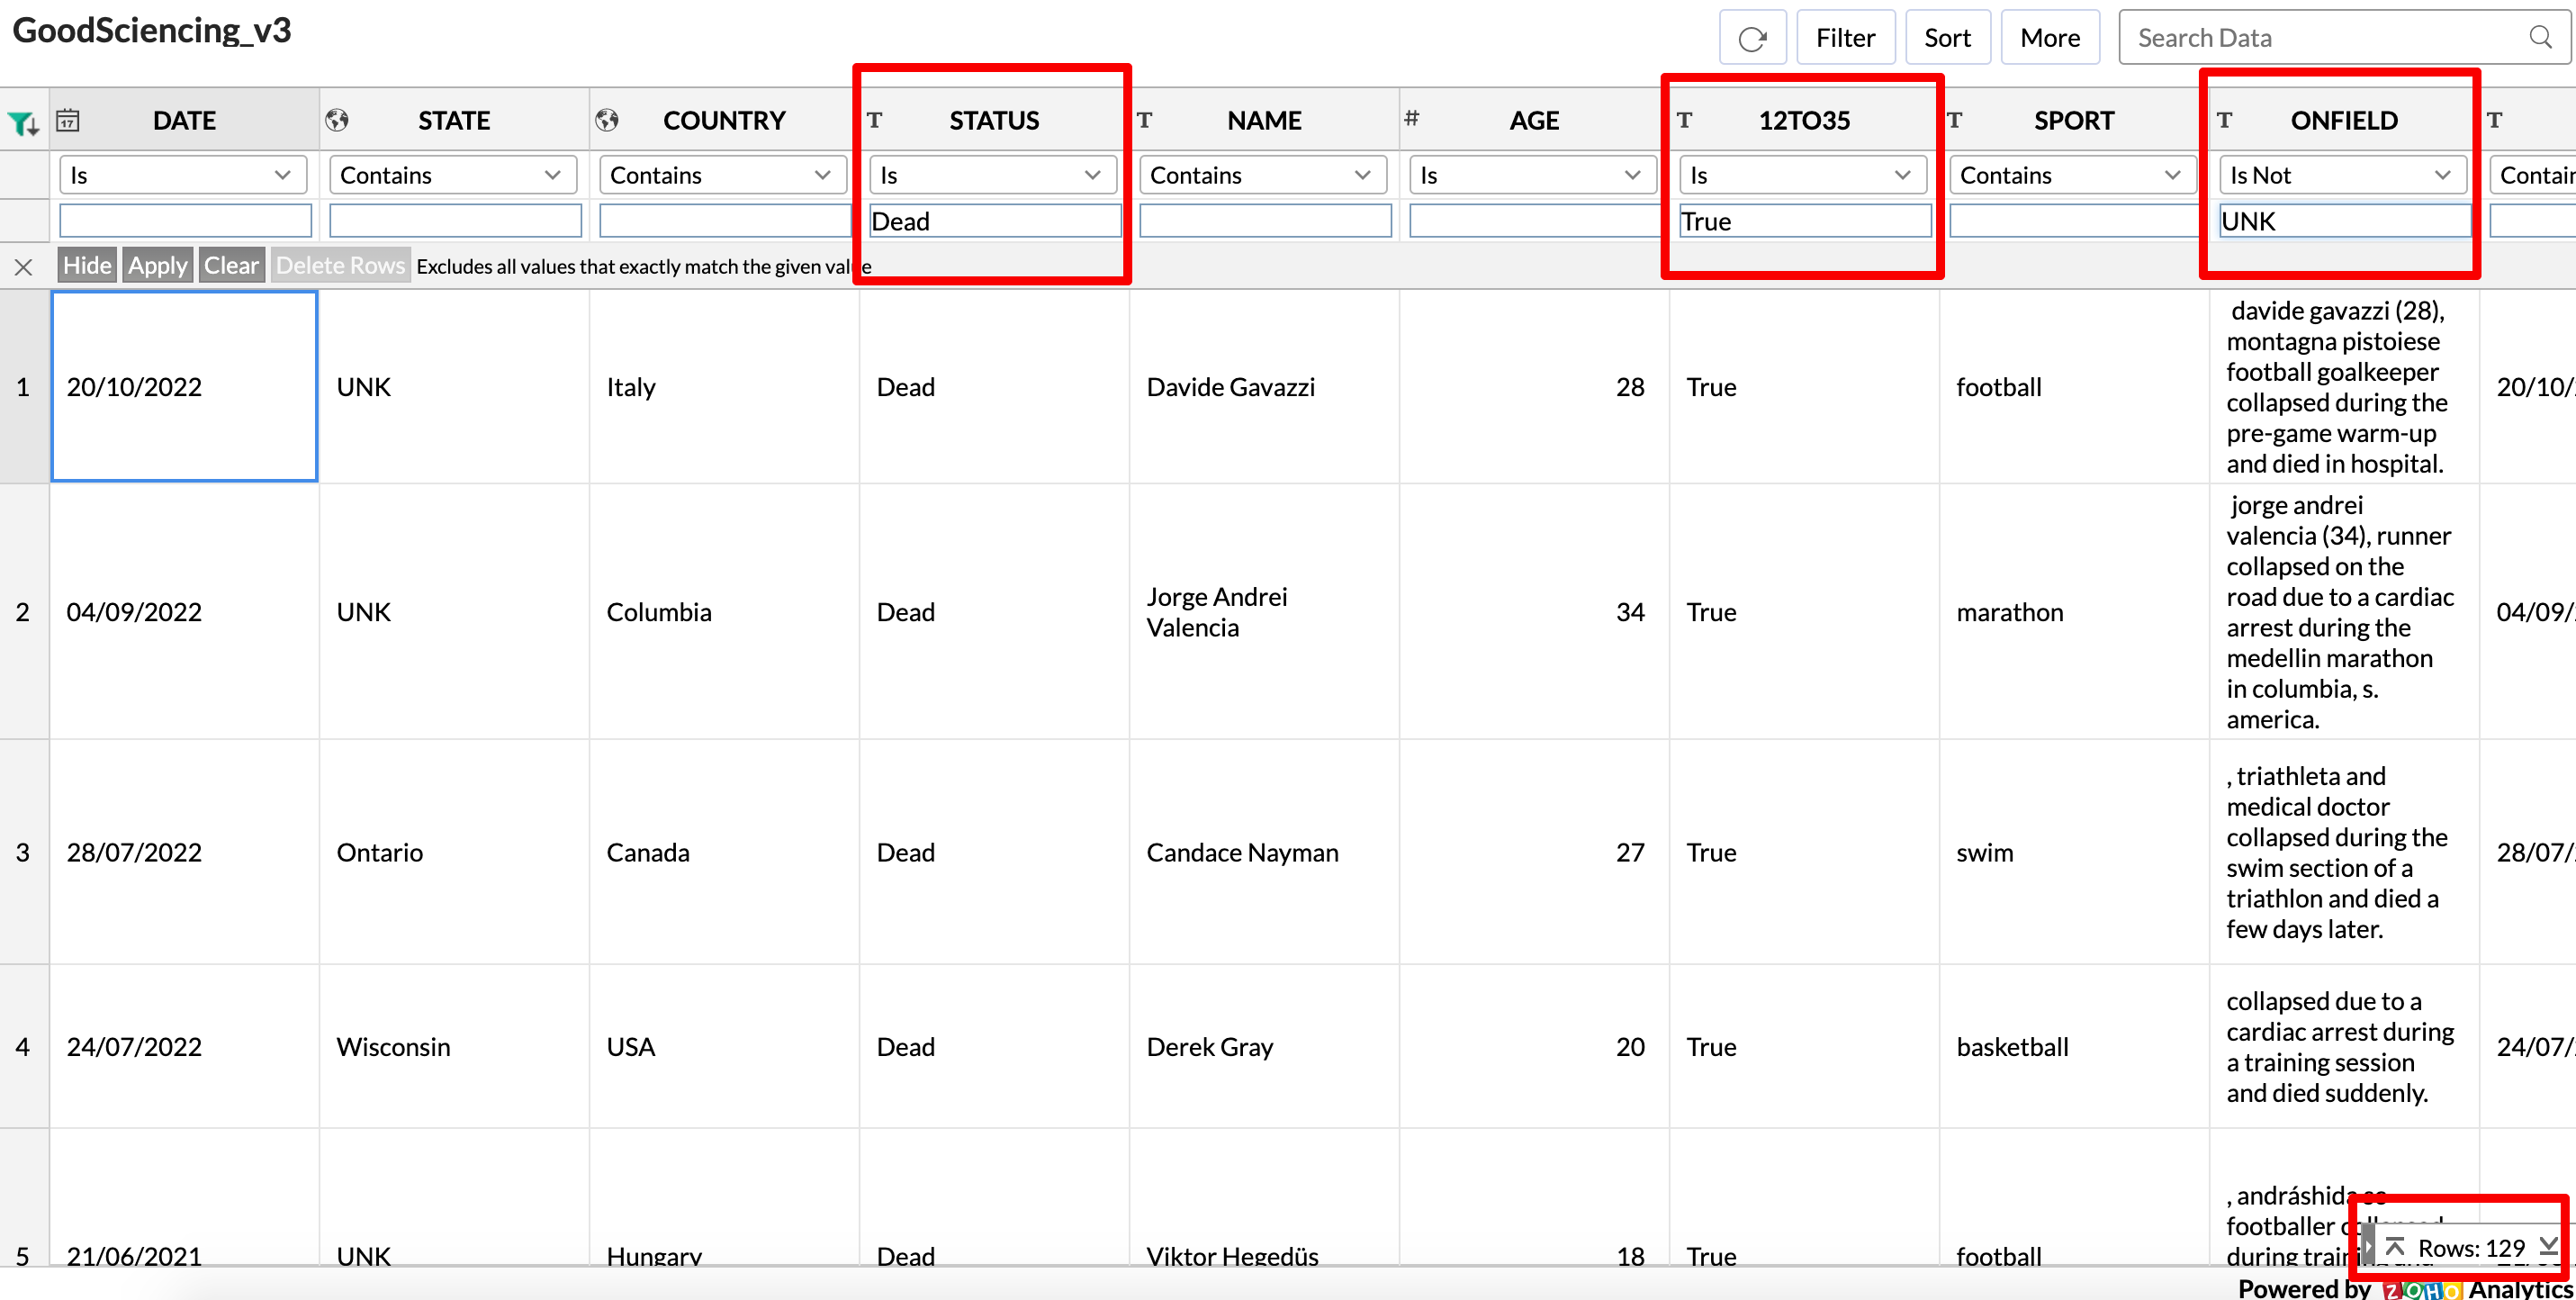
Filter for ONFIELD != ‘UNK’ and AGE between (12, 35) and Status = ‘Dead’ and you get 129 results over a two year period.
Technically, this must be compared with the 30/year from the LS dataset. When you compare the two numbers (60 vs 129), that is still a doubling after the mRNA rollout, provided you can manually vet this filtered dataset and confirm they are mostly accurate.
There is a second way to get the same result.
Filter for STATUS=’Dead’ and 12TO35=’True’ and ONFIELD!=’UNK’
However, the number of results for this filter is probably going to go up over the next few days and I will explain why in the next section.
The 12TO35 column
Sometimes the exact age is not known. Where it is known and if it is between 12 and 35 I simply mark it as True, and False if it is outside the range.
But even for the events where the age is not available but you can make a reasonable guess that it must be a person in that age range.
Here is a good example:
Barron Mann (Age), amateur boxer and student, died suddenly 5 days before his college graduation
I will be manually updating the 12TO35 from UNK to True for these events when I get a chance. You will know which ones got updated if you filter for AGE = -1 and 12TO35 != ‘UNK’
So you should expect the 129 to go up slightly higher over the next few days as I do the manual checks.
More questions
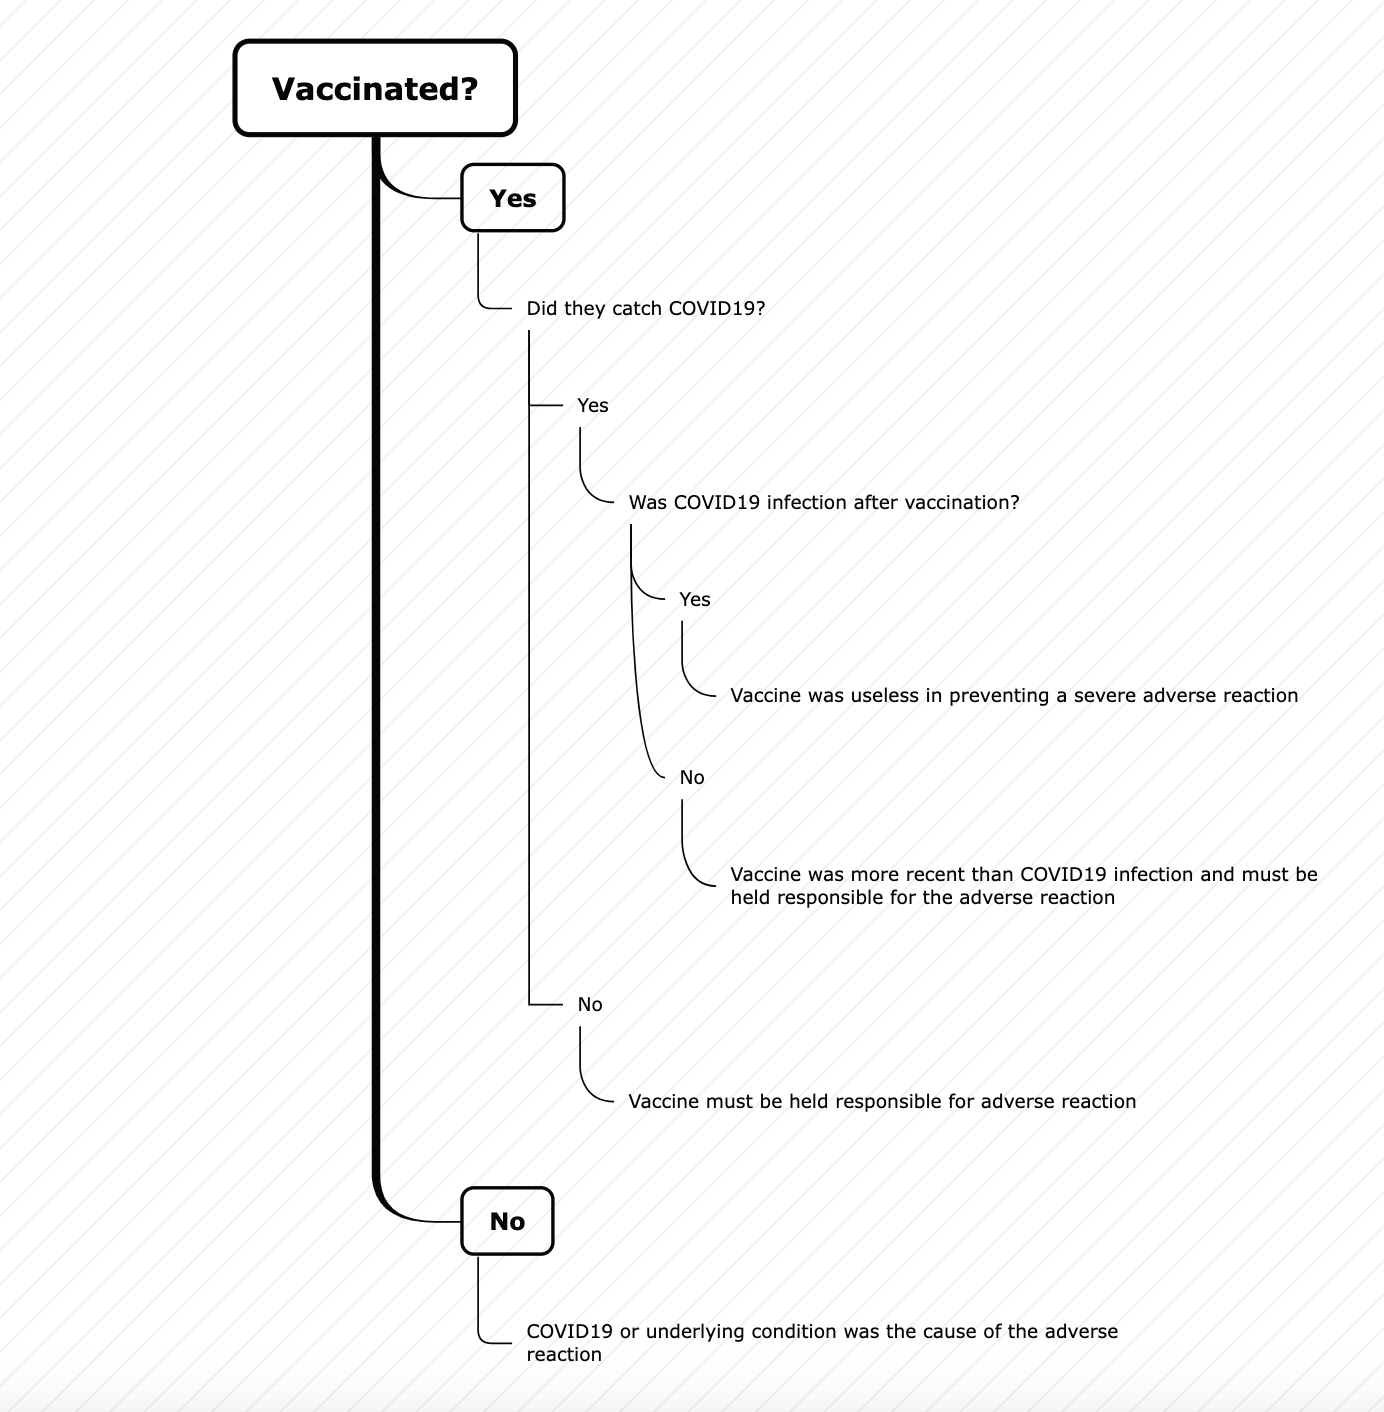
There are of course two more questions which need to be asked to answer the question about vaccines.
Were they actually vaccinated?
Did they get COVID19, and was it after vaccination?
By the way, in my opinion, if they got COVID19 first, then get vaccinated, and then died from a cardiac issue then the vaccine (which was most recent) must be held responsible. That is how we have usually attributed causality in the past.
If they got vaccinated first and then got COVID19 which was severe enough to cause the adverse reaction, then the vaccine was not effective.
In other words, the flowchart is not looking very good for those who got vaccinated in my opinion.